
The most profound change occurring in the technology world is the huge increase in the amount of data that flows through our data communications systems every day. Until recently, we measured this flow in terms of petabytes per month. One petabyte equals one million gigabytes or one trillion bytes, which in more easily conceivable terms equates to 13.3 years of non-stop HD video. Cisco estimates that monthly internet traffic in 2010 totaled 21,380 petabytes per month, or 10.9GB per month per user.
Today, there are over 7.7 billion people in the world and more than 51 percent of these people are connected to the internet. If each only used 10.9GB of data per month – which is roughly equivalent to 11 hours of standard streaming video, or just shy of four hours of HD streaming video – that would equal 42.5 exabytes (EB) of data passing through the internet each month.
One exabyte equals 1,000 petabytes, or roughly 13,300 years of HD video data, which is again difficult to conceive of. In fact, a petabyte is so enormous, it’s better imagined in terms of our solar system. As BACKBLAZE put it, “If one gigabyte is the size of the Earth, then an exabyte is the size of the sun.”
What’s more, the 42.3EB/month figure doesn’t even count machine-to-machine (M2M) communications, which will approach 14.7 billion connections by 2023. The amount of data the world produces each day is extraordinary!
The drivers for connector use by the telecom market are largely based on consumer behavior and the consumption of data. Today, everyone wants to be connected all the time, whether it is for work or leisure. Consequently, these connections are increasingly becoming wireless.
In 2019, the telecom/datacom market for connectors was the second largest market for connectors after the automotive market. The telecom/datacom market represented over 22 percent of the total connectors sold in 2019. This market share increased in 2020 as the 1.8 percent decline in sales was significantly less than suffered by the automotive connector market.
Figure 1: 2019 and 2020 Telecom/Datacom Connectors Sales by Region with Percentage Change
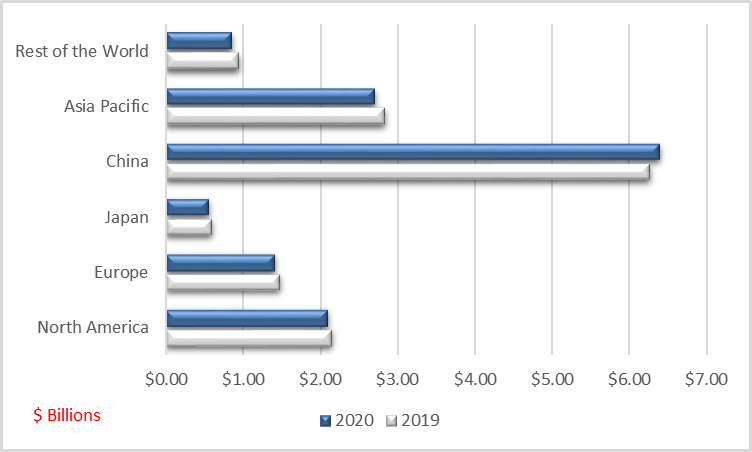
It is anticipated that all regions with exception of China will decline single digits in 2020. Japan is expected to experience the greatest decline, down by 8.1 percent. The graph below depicts the change in telecom/datacom connectors by region for 2020 compared to 2019.
Figure 2: World Telecom/Datacom Connector Market by Region, 2019-2020
According to data collected by the International Telecommunication Union (ITU), fixed telephone connections are decreasing while mobile connections are increasing, and both mobile and fixed broadband connections continue to rise.
While the number of fixed broadband subscriptions have almost doubled since 2010, the number of mobile subscriptions has increased by 7.5 times. The 10 countries with the most fixed broadband subscriptions each have more than 750,000 subscribers; however, these same countries each have over 3,990,000 mobile subscriptions as telecommunication systems have undergone considerable evolution for both fixed and mobile/wireless systems to handle the increased volumes. Fixed systems have gone through over a century of evolution.
For example, switching equipment has advanced from manually-operated switchboards to mechanical switching, analog electronic switching, digital switching, packet switching and routing. Today, digital IP switches are widely deployed throughout the world. Transmission equipment has gone through a similar progression, from coaxial and twisted-pair media to TDM multiplexing, early fiber optic transmission, wavelength division multiplexing (WDM/DWDM), reconfigurable optical add-drop multiplexers (ROADM), and now the maturing Optical Transport Networks (OTN).
The synchronous optical network and synchronous digital hierarchy (SONET/SDH) families of transmission products were the dominant technology for many years. But they have since given way to OTN, which carries the legacy SONET/SDH, DWDM and, most importantly, Carrier Ethernet.
Early datacom network access consisted of analog current loops and, later, pair-gain systems. Subsequent developments included digital subscriber line systems (DSL), which run on an asynchronous transfer mode (ATM) physical layer, and optical networks, which may be active or passive in design. The latest service offering is driven with Carrier Ethernet since it is the lowest-cost access technology and the language of the internet. Carrier Ethernet networks can be based on either copper or fiber optic cable, depending on where they are deployed.
The mobile/wireless infrastructure used to provide cellular service has changed significantly in the last three decades, and these changes will continue into the next decade. Originally intended for just voice transmission, wireless networks have morphed into the primary access for the internet, particularly in developing countries.
In 2008, the ITU introduced 4G specifications, which required transmission rates of 100Mb/s for mobile applications and 1Gb/s for stationary applications. Long-Term Evolution (LTE) has been the quest to achieve those rates, which became synonymous with 4G LTE. This was really the first truly mobile broadband.
In 2019, implementation of the infrastructure needed for the first version of 5G started with limited installations in major cities. The higher frequency bands, 30GHz or more with faster transmission rates, are limited by distance and transmission media. They cannot, for instance, penetrate walls and glass windows, and they are absorbed by the atmosphere. They require a direct line of sight between the user’s device and the cell tower. When a 5G phone is not within range of these high-frequency 5G systems, it reverts to using 4G signals, typically in the 2.4GHz to 6GHz range. These signals are better able to travel longer distances and penetrate barriers.
Wireless Communications Components
Many electronic technologies play a role in 4G and 5G installations, including antennas, RF and microwave products, fiber optics, and other key elements, notably:
- Active antenna systems, which improve the performance of transceivers and can be mechanically adjusted to direct energy to the user. These systems electronically form the signal in a process called beamforming.
- mMIMO (massive multiple-input, multiple-output) antennas, which aim the beams through interference patterns and potentially contain hundreds of small antenna elements per antenna.
- Integration (aggregation) of different elements of the radio, the radio network controller, control units, distribution units, and front haul and backhaul equipment.
- Virtualization of many functions, such as authentication and billing systems: the continuing proliferation of internet protocols (IP) and Open Compute efforts to allow the management of voice, video and data through generic routers and servers, versus the specialized equipment that has been the mainstay of the industry up to now. As such, telecommunication is essentially morphing into plain old data communications.
Looking Ahead
As a result of increasing consumer and commercial business demands, the demand for connectivity equipment needed for these systems is growing at significant rates. With an overgrowth rate exceeding 8 percent in the next five years, connector sales are expecting to reach almost $21 billion in 2025.
The two fastest growing equipment sectors are wireless infrastructure and enterprise equipment, such as server farms. The fastest growing region is China, and the fastest growth connector product category is fiber optics. The implementation of 5G infrastructure and products that use this accelerated level of connectivity will only increase the amount of data the world produces and consumes.
Further information about the telecom/datacom market for connectors can be found in the just published “World Telecom Connector Market” report, which provides an in-depth review of the explosive growth of the telecom market, including trends impacting IP-based equipment, 5G, and growth forecasts. This report includes analyses by primary equipment group, equipment type, region, and connector type, with detailed statistics of the world telecom connector market.
Statements of fact and opinions expressed in posts by contributors are the responsibility of the authors alone and do not imply an opinion of the officers or the representatives of TTI, Inc. or the TTI Family of Companies.
