
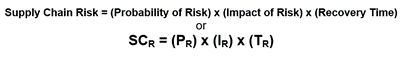
In Part 1 of this series, we defined a basic measure of supply chain risk that seeks to take into account event risk and the corresponding potential impact of that risk, as well as how long it might take to recover from that specific type of risk event. You may remember how this simple measure can be shown as:
In this installment, we will walk through the basic steps of developing a quantifiable measure of supply chain risk that can help guide corporate actions and priorities – ultimately reducing overall supply chain risks
To develop this quantitative measurement, we need to establish specific values for the three variables shown in the formula above. Determining appropriate values for three elements of your business allows you to construct a very useful Supply Chain Risk Scorecard. Those elements are:
(A) Your key components and materials …
(B) … across each of your key vendors, and …
(C) … for each of the previously-elaborated seven risk categories (below)
Seven Common Sources of Supply Chain Risk:
- Source concentration
- Lead times
- Obsolescence
- Scalability
- Geopolitical
- Natural disasters
- Legal challenges
As daunting and time-consuming as this endeavor might seem, this is a case where the perfect cannot be allowed to be the enemy of the good. It is far better to go through this exercise with imperfect data than to not do it at all.
Assigning values to these variables need not involve elaborate, painstaking and costly research and analysis. It can be made far less cumbersome by using a combination of thoughtful estimates and well-constructed proxies for each number assigned. As so many of these probabilities and impacts are either probabilistic, or not precisely knowable, thoughtful estimates may provide just as good of a result as elaborately quantifying the supply chain risks components of a Supply Chain Risk Scorecard (SCRS).
This process will in no way represent a perfectly quantified assessment of risk, but rather a means of determining relative risk across your supply chain so that risk reduction and risk mitigation measures can be prioritized to address the most significant risks.
Developing Your Scorecard
To develop the Supply Chain Risk Scorecard inputs for your specific supply chain, products and demand profile, we must quantify both risk probability and risk impact; we must also attempt to estimate recovery time. I usually find recovery time to be the most problematic to estimate as it could be influenced by so many different factors. So, for estimating recovery time, I try to consider the most likely type of disruption for each risk category and figure out what the likely response would be.
In some extreme cases, recovery time may need to include selecting and qualifying a new part from a new vendor, which for some products (such as medical or aerospace designs) can be a fairly long process.
For each major source of supply chain risk, there are numerous ways to quantify probability and impact. For the purpose of this article, we will only talk about the methods of quantification superficially and focus more on developing the actual SCRS tool.
Estimating Your Level of Risk
With risk factors such as source concentration, lead time and scalability, your risk probability should be a proxy number derived in part from specific measures of each of these factors, rather than an actual probability.
A sole-sourced part generally has more risk than a part with multiple sources, and a part with a 26-week lead time is far more difficult to react to than a part with a two-week lead time. So, for simplicity, when substituting a proxy measure such as lead time for an actual calculated probability, it is best to use a specific set of proxy scores consistently across all of your various components and vendors, giving you an “apples to apples” comparison of risk
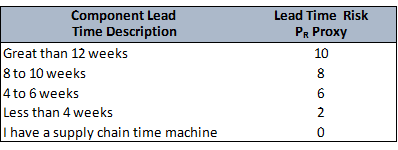
The figures below provide an example of just one potential proxy set for source concentration risk and lead times, but there are numerous other approaches that could also be used effectively.
Figure 1: Example of Possible Proxy Scale for Source Concentration
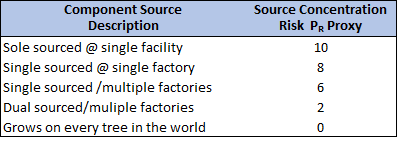
Figure 2: Example of Possible Proxy Scale for Lead Time
Similar proxy measures should be developed for other risk factors, such as scalability, which can be best quantified as some specific measure that is not an actual probability. Most often, the risk to loss of supply continuity associated with scalability relates to a supplier’s ability or inability to expand output to meet demand – especially un-forecasted demand. Developing a proxy measure for scalability risk most often involves determining the amount of time it would take for a supplier to add some defined level of additional capacity.
Scalability risk is also used to capture the risk associated with a supplier going out of business as that would de-scale all of your supply. This can be addressed a number of ways. To make the overall tool a bit simpler to use, this proxy measure for scalability risk – along with every other risk measure – should be constructed on a scale from 1 to 10 (although I like to throw a zero into the scale, for levity) to facilitate comparison of risks on a relative basis.
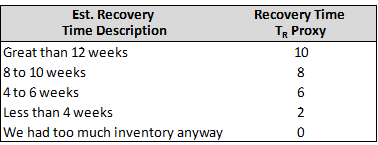
Specific 1-to-10 scales can also be used to indicate the severity of impact of a risk event as well as the estimated duration of recovery time, as shown in these examples:
Figure 3: Example of Possible Scale for Impact of Risk
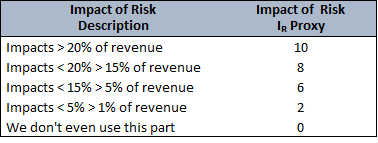
Figure 4: Example of Possible Scale for Recovery Time
In a more detailed model, a risk impact number would be derived based on a broader range of considerations, including the economics, brand protection and longer-term customer impact of the loss of supply on a particular product. Spending a bit of extra time to really understand the impact of a loss of supply continuity can be a very useful exercise, and almost always reveals important issues beyond the obvious immediate financial impact.
Other risk factors from the list above should also be estimated on a consistent scale. For issues like geopolitical risk and natural disaster risk, there are a number of governmental on non-profit organizations that publish data that could be useful in constructing your risk scale. The OECD, World Bank, UN, NOAA, and others can be good sources for helping to build your risk scale and determining how risky various supplier locations may be.
Building Your Scorecard
Now that we’ve been through the basics of developing the various inputs, it’s time to assemble them into an overall scorecard to get a broader picture of where your biggest supply chain risks lie.
When compiling the SCRS, every component or subassembly in the product should be subject to this scoring process, except for widely-available COTS components produced by numerous vendors according to some widely agreed-upon industry standard. The scorecard should be arranged by supplier, with all of the parts from each supplier listed and scored together.
Figure 5: A Detailed Sample Supply Chain Risk Scorecard
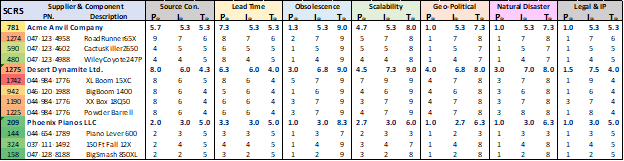
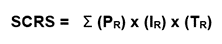
On the left side of the scorecard are the total risk scores for each component. This risk score is the sum of all of the individual risk scores which are derived by multiplying the risk probability number by the risk impact number and then multiplying that by the recovery time number for each risk category. So to get the total risk score for each component, simply take the sum of all of the individual risk scores, or:
To calculate the individual risk factor score at the supplier level, just take the average of all of the individual scores (Probability, Impact and Recovery Time) for each of your seven risk factors and multiply them together.
For the overall risk score at the supplier level, do just as we did at the component level and take the sum of all of the individual factor risk scores.
This is best illustrated below in a summary presentation of the SCRS that does not show all three components.
Figure 5: Sample Supply Chain Risk Scorecard
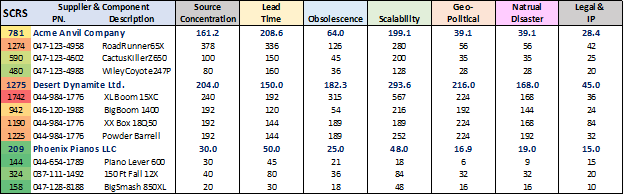
Looking at the example scorecard above, we can see that one particular supplier has a very high overall risk score. There are also a number of individual components that show an elevated level of risk. Rank ordering the risks scores from highest to lowest is a good way to get an initial feel for where to focus your attention on supply chain risk mitigation.
In the next article, we will look at the various actions that can be taken to minimize supply chain risk, and how to determine what mitigation steps are best for the various types and sources of risk.
Statements of fact and opinions expressed in posts by contributors are the responsibility of the authors alone and do not imply an opinion of the officers or the representatives of TTI, Inc. or the TTI Family of Companies.
