
The connector industry had a reasonably good year in 2024, increasing sales by 5.6%. Orders were also positive, up 8.6% year-over-year. Order backlog was $21.3 billion at year end, up $270 million from 2023’s ending backlog of $21.0 billion.
The following table shows the percentage change in orders and sales by region of the world:
Percentage Change
2023 versus 2024
| Region | Orders | Sales |
| North America | 11.2% | 6.8% |
| Europe | -7.3% | -3.2% |
| Japan | -2.8% | -13.8% |
| China | 18.0% | 12.1% |
| Asia Pacific | 27.4% | 19.2% |
| ROW | 0.9% | -15.7% |
| Total World | 8.6% | 5.6% |
Results by Region
The industry shipped $86.5 billion in 2024, up from $81.9 billion in 2023.
2023 and 2024 Connector Sales
by Region with Percent Change
| Region | 2023 | 2024 | Percent Change |
| North America | $18,840.8 | $20,124.7 | 6.8% |
| Europe | $17,992.7 | $17,417.3 | -3.2% |
| Japan | $4,683.7 | $4,035.8 | -13.8% |
| China | $24,977.1 | $28,003.5 | 12.1% |
| Asia Pacific | $11,310.0 | $13,483.5 | 19.2% |
| ROW | $4049.8 | $3,412.9 | -15.7% |
| Total World | $81,854.1 | $86,477.7 | 5.6% |
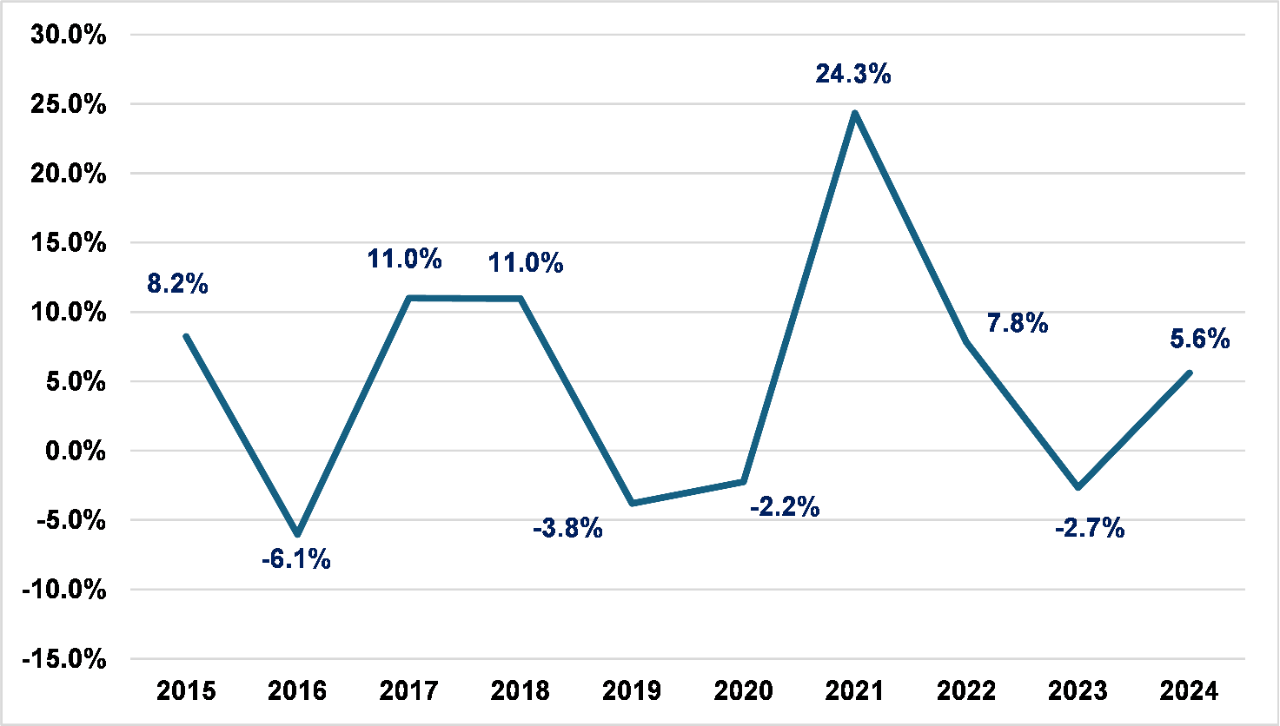
2024 Compared to Past Results
Sales growth of 5.6% is slightly better than the past 10-year compound annual growth rate (CAGR) of 4.5%.
The following chart compares connector sales performance over the last 10 years. We have experienced a low of -6.1% in 2016 and a high of 24.3% in 2021. There were four down years and six growth years.
2024 Results by Market Sector
During the past 10 years, the growth markets were automotive, industrial and military/aerospace. These markets were the most profitable and therefore very desired by connector companies.
In 2024, computer and peripherals and telecom/datacom markets were the fastest growing. Note the table below that illustrates computer and peripherals up 10.7% and telecom/datacom up 9.8%.
2023 and 2024 Connector Sales
by End-Use Equipment Sector with Percent Change
| End-Use Equipment Sector | 2023 | 2024 | Percent Change |
| Computers & Peripherals | $9,979.5 | $11,050.4 | 10.7% |
| Business/Office Equipment | $875.4 | $878.3 | 0.3% |
| Instrumentation | $2,364.8 | $2,428.4 | 2.7% |
| Medical | $2,659.7 | $2,720.2 | 2.3% |
| Industrial | $10,742.3 | $11,062.9 | 3.0% |
| Automotive | $18,502.7 | $19,149.2 | 3.5% |
| Transportation | $5,857.4 | $6,025.2 | 2.9% |
| Military/Aerospace | $5,092.7 | $5,291.8 | 3.9% |
| Telecom/Datacom | $18,991.4 | $20,860.9 | 9.8% |
| Consumer | $3,744.4 | $3,890.5 | 3.9% |
| Other Equipment | $3,043.8 | $3,119.9 | 2.5% |
| Total World | $81,854.1 | $86,477.7 | 5.6% |
| $ in Millions | Bishop & Associates ©2025 | ||
There are several reasons why computer and peripherals and telecom/datacom markets are the two market sectors witnessing the greatest growth.
- Growth in the use of artifical intelligence (AI), which has stimulated large scale investments in data centers and telecom.
- The drive towards the next generation of mobile networks, 6G. Slated to be 50 times faster than 5G and offering microsecond latency, 6G is anticipated to be cheaper by using AI to aid in network selection.
- Expanded use of robots, including autonomous mobile robots (AMRs), humanoids, automated guided vehicles (AGVs), cobots, articulated robots and hybrids, which are all designed to increase efficiency, improve safety and acclerate processes while requiring high-speed, dependable computational capabilities.
- On-going development of autonomous vehicles, consumer and commercial types. Autonomous vehicles will depend on real-time data sharing between vehicles, networks, infrastructure and pedestrians made possible by vehicle-to-everything (V2X) communication and robust wireless high-speed, reliabile connectivity.
2025 Bishop Forecast
We believe 2025 will be another positive year with sales up 7.9%. Our prediction by region is noted below:
2023, 2024 and 2025 Connector Sales
by Region with Percent Change
| Region | 2023 | 2024 | Percent Change | 2025 | Percent Change |
| North America | $18,840.8 | $20,124.7 | 6.8% | $21,713.9 | 7.9% |
| Europe | $17,992.7 | $17,417.3 | -3.2% | $17,934.5 | 3.0% |
| Japan | $4,683.7 | $4,035.8 | -13.8% | $4,124.9 | 2.2% |
| China | $24,977.1 | $28,003.5 | 12.1% | $31,020.8 | 10.8% |
| Asia Pacific | $11,310.0 | $13,483.5 | 19.2% | $14,978.6 | 11.1% |
| ROW | $4,049.8 | $3,412.9 | -15.7% | $3,502.6 | 2.6% |
| Total World | $81,854.1 | $86,477.7 | 5.6% | $93,275.3 | 7.9% |
| $ in Millions | Bishop & Associates ©2025 | ||||
In our opinion, the first half of 2025 will result in modest growth, driven by the previously mentioned robust backlog. We anticipate the second half to be strong, driven by several factors, including:
- An increase in consumer consumption and, in turn, spending, supported by increased wages.
- Lower interest rates, stimulating investments and consumer borrowing.
- A decline in inflation.
Because we are living in turbulent times, it is important to note that at any time the following occurrences could affect 2025’s performance:
- Increase or change in governmental regulations.
- Availability of skilled employees.
- Change in geopolitical landscape.
Five-Year Outlook
We believe the industry will achieve $100 billion in sales in 2027. Our five-year outlook by region is noted below:
2025 and 2030 Connector Sales
by Region with Five-Year CAGR
| Region | 2025 | 2030 | 5-Yr CAGR |
| North America | $21,713.9 | $28,808.7 | 5.8% |
| Europe | $17,934.5 | $23,043.5 | 5.1% |
| Japan | $4,124.9 | $4,985.6 | 3.9% |
| China | $31,020.8 | $44,286.7 | 7.4% |
| Asia Pacific | $14,978.6 | $20,501.3 | 6.5% |
| ROW | $3,502.6 | $4,259.0 | 4.0% |
| Total World | $93,275.3 | $125,884.8 | 6.2% |
| $ in Millions | Bishop & Associates ©2025 | ||
The connector industry will have sales exceeding $125 billion by 2030, with China being the largest region, followed by North America.
Incorporated in 1985, Bishop & Associates, Inc. is a market research firm specializing in the connector and cable assembly industry. The firm publishes the monthly Bishop Report, a newsletter focusing on the connector industry, as well as Industry News Briefs and Updates, The Connector Yearbook and a variety of research reports covering the connector and cable assembly market, it’s products and its manufacturers. To learn more, or to subscribe, follow this link.
Follow TTI, Inc. on LinkedIn for more news and market insights.
Statements of fact and opinions expressed in posts by contributors are the responsibility of the authors alone and do not imply an opinion of the officers or the representatives of TTI, Inc. or the TTI Family of Specialists.