
The total booking euros reported for all switch categories in Europe for Q2 2020 came in 36 percent below the previous quarter and below Q2 2019 by 18 percent. The second quarter’s book-to-bill ratio for euros was 0.749. Booking units in Q2 2020 were down 31 percent from Q1. The first quarter’s book-to-bill ratio for units was 0.839.
Compared to Q1 2020, the second quarter shows lower euros and/or units for the majority of switch categories. In total, euros were down 11 percent, units dropped 18 percent and ASP improved 8 percent on increases in half the categories.
In year-over-year data, Q2 shows similar results: in total, euros decreased 9 percent, units fell 5 percent and the ASP decreased 4 percent with over half of the eight categories increasing and a mix shift to lower priced switches. Year to date, euros slipped in the majority of categories and 6 percent in total units shrank 4 percent. ASPs for four of eight categories increased, but the total slipped 4 percent on a mix shift to lower priced switches.
Sales Growth by Switch Category
|
Q2 2020 Versus Q1 2020 |
Q2 2020 Versus Q2 2019 |
YTD 2020 Vs. YTD 2019 |
||||||
Category |
Euros |
Units |
ASP |
Euros |
Units |
ASP |
Euros |
Units |
ASP |
DIP |
-7.3% |
-11.4% |
4.7% |
-16.1% |
-18.1% |
2.4% |
-15.5% |
-11.6% |
-4.4% |
Keylock |
-1.7% |
-33.3% |
47.5% |
-9.1% |
-28.7% |
27.5% |
-17.7% |
-19.5% |
2.3% |
Push Button |
-8.4% |
-16.5% |
9.6% |
-5.9% |
-24.2% |
24.1% |
-4.5% |
-14.7% |
11.8% |
Rocker |
-24.9% |
0.0% |
-24.9% |
-10.4% |
-16.2% |
6.9% |
-1.6% |
-16.8% |
18.3% |
Slide |
-9.0% |
-3.7% |
-5.5% |
7.4% |
-11.2% |
20.9% |
5.2% |
-7.9% |
14.0% |
Snap Action |
-10.2% |
-6.8% |
-3.7% |
-17.3% |
-13.3% |
-4.6% |
-12.0% |
-11.3% |
-0.8% |
Tact |
-9.5% |
-16.0% |
7.8% |
4.0% |
5.2% |
-1.2% |
-5.3% |
-3.8% |
-2.0% |
Toggle |
-16.9% |
-9.7% |
-7.9% |
-12.1% |
-0.7% |
-11.4% |
0.3% |
0.1% |
-0.2% |
Total |
-11.2% |
-18.0% |
8.3% |
-9.2% |
-5.5% |
-3.9% |
-6.5% |
-3.7% |
-3.3% |
When compared to the first quarter total bookings dropped in euros and units, for the majority of categories. In total, euros fell 36 percent and units were 31 percent less. The average booking price shrank 7 percent in total with half of the categories decreasing. Results compared to the same quarter last year has euros and units decreasing for most categories. In total, euros were down 18 percent and units were 11 percent lower, with the ABP falling 8 percent.
For 2020 to date, booking euros and units decreased in total, with euros rising for most categories, units lower in the majority of categories. In total, euros were down 3 percent and units, 1 percent lower. The total ABP was 2 percent lower on mix shift to lower priced switches.
Bookings Growth by Switch Category
|
Q2 2020 Versus Q1 2020 |
Q2 2020 Versus Q2 2019 |
YTD 2020 Vs. YTD 2019 |
||||||
Category |
Euros |
Units |
ABP |
Euros |
Units |
ABP |
Euros |
Units |
ABP |
DIP |
-31.3% |
-53.2% |
46.9% |
-3.4% |
-15.0% |
13.6% |
15.2% |
20.8% |
-5.3% |
Keylock |
-29.6% |
-38.4% |
14.2% |
5.0% |
-33.0% |
56.7 % |
7.9% |
-14.2% |
26.0% |
Push Button |
-15.4% |
6.3% |
-20.4% |
-7.4% |
12.2% |
-17.5% |
1.6% |
13.6% |
-10.8% |
Rocker |
-15.3% |
-21.5% |
7.9% |
-8.5% |
-15.4% |
8.2% |
-2.0% |
-7.1% |
5.5% |
Slide |
5.2% |
0.3% |
4.9% |
23.0% |
4.6% |
17.6% |
9.7% |
-1.6% |
11.7% |
Snap Action |
-46.2% |
-44.8% |
-2.5% |
-34.2% |
-31.7% |
-3.8% |
-13.2% |
-11.9% |
-1.5% |
Tact |
-23.7% |
-9.2% |
-16.0% |
7.4% |
2.5% |
4.8% |
4.9% |
-5.6% |
11.6% |
Toggle |
-27.9% |
-31.1% |
4.6% |
-36.6% |
-43.4% |
12.0% |
-21.3% |
-24.8% |
4.1% |
Total |
-36.3% |
-31.2% |
-7.4% |
-17.9% |
-10.8% |
-8.1% |
-2.8% |
-0.8% |
-2.2% |
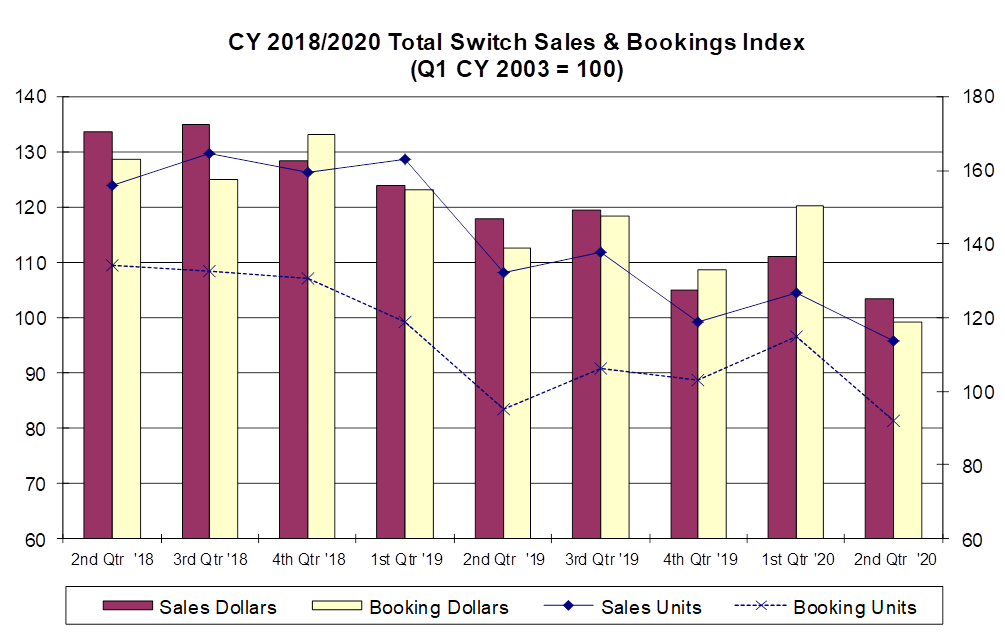
The graph below shows total quarterly indexed sales and bookings in euros and units for the reported data since Q2 CY 2018. 2018 started with a new two-year high in booked euros and units then both fell to a bottom in the fourth quarter of last year and improved nicely in Q1. Bookings dropped sharply in Q2 as sales fell less dramatically.
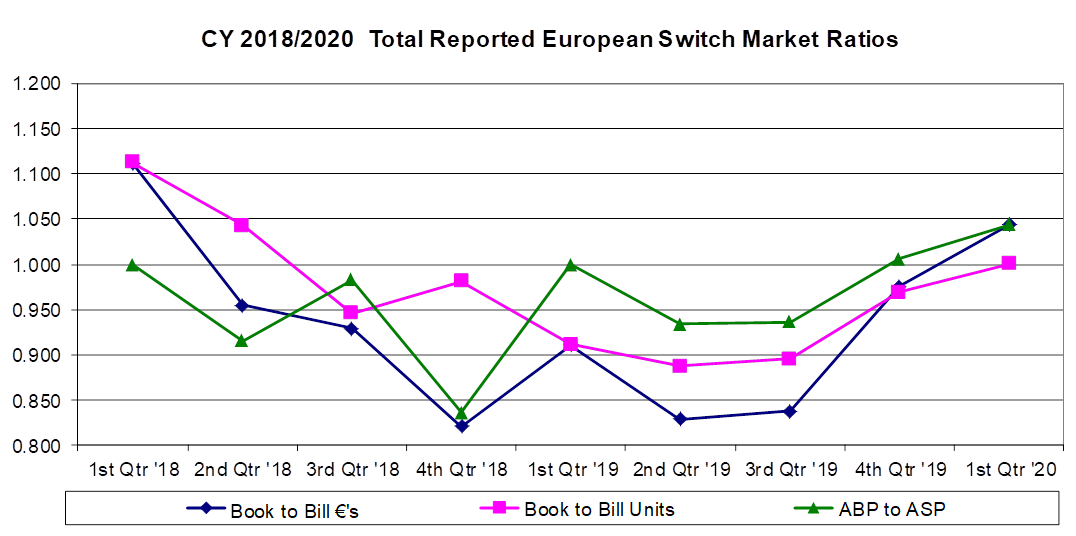
Book-to-bill euros and units both set two-year highs in 2017, declined to a bottom in the middle of 2019, and improved the last two quarters. The ABP-to-ASP ratio has been at or below 1.0 for most the period, except for the last two quarters.
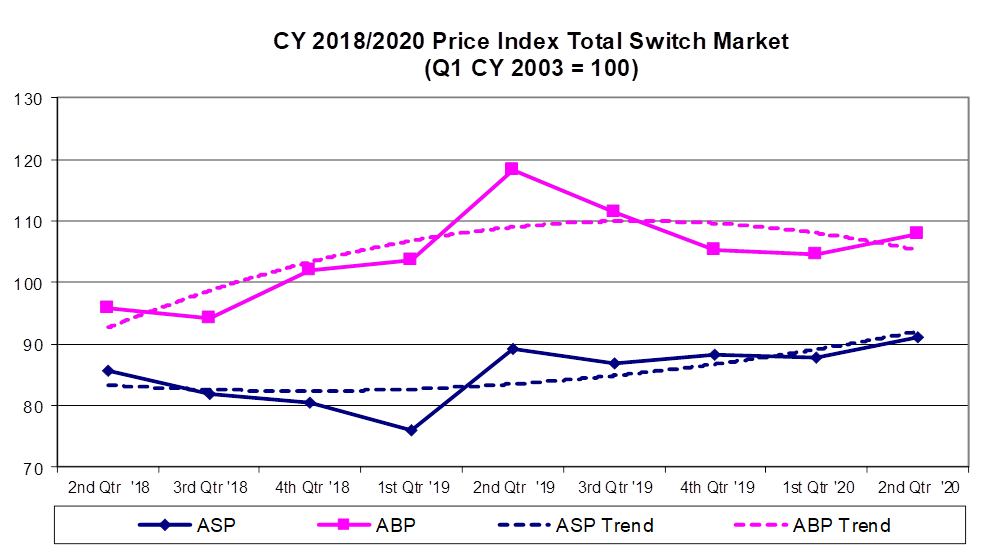
Indexed selling prices increased to a peak in Q2 of 2019 and then fell until the first quarter of 2020. Indexed booking prices have run below selling prices for the period.
Follow TTI, Inc. on LinkedIn for more news and market insights.
Statements of fact and opinions expressed in posts by contributors are the responsibility of the authors alone and do not imply an opinion of the officers or the representatives of TTI, Inc. or the TTI Family of Businesses.
